New Zealand flood information
Understand flood risk in your region
Flooding behaves differently across Aotearoa. Local rainfall, rivers, coastlines, ground levels, stormwater networks and flood-protection schemes all affect where water may travel. Use this guide to find authoritative local maps, river and rainfall monitoring, webcams where available, and practical preparation information.
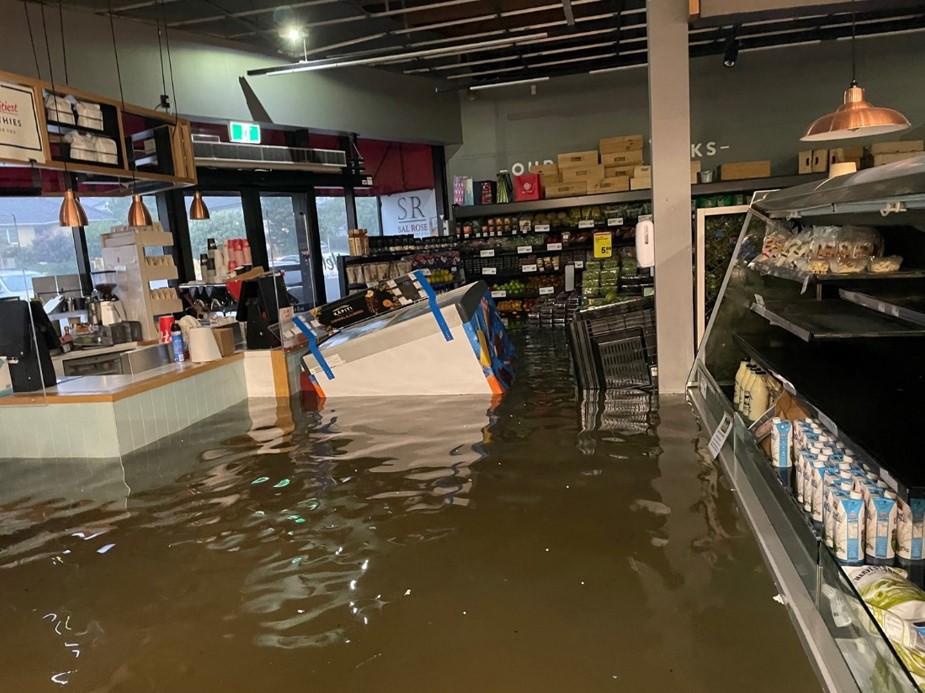
January 2023 Auckland flooding. Photo: Foodstuffs North Island.
Check conditions now
Start with official warnings, then check your regional council’s river and rainfall network. Monitoring data is often provisional and a normal reading at one gauge does not guarantee that nearby streets, streams or properties are safe.
Weather warnings
MetService warnings and watches
Official severe-weather warnings, watches and outlooks.
Emergency advice
What to do before, during and after a flood.
Water data
River flow, rainfall and groundwater information from around New Zealand.
Why flooding happens
River flooding
Heavy rain across a catchment can raise rivers well after rain has eased locally. Stopbanks and river schemes reduce risk, but no defence removes it completely.
Surface and flash flooding
Intense rain can exceed the capacity of soils, drains and pipes. Water then follows low points and overland flow paths, sometimes forming quickly away from a major river.
Coastal flooding
High tides, storm surge, waves and low pressure can raise coastal water levels. River and stormwater outlets may also drain more slowly when the receiving tide is high.
Saturated ground
After prolonged rain, soils absorb less water and runoff can increase. Slips, ponding and groundwater-related flooding may occur even without record hourly rainfall.
Snow and alpine catchments
Snow stores water in the mountains. Thawing contributes to seasonal river flow, and warm rain falling on snow can add runoff in some South Island catchments.
Urban growth and roads
Roofs, paving and roads create faster runoff than natural ground. Earthworks and raised surfaces can alter local flow paths, so drainage must be considered from upstream to downstream.
How flood infrastructure works
Regional and local councils use different combinations of assets depending on the catchment. These systems manage water; they do not make every property flood-proof.
Stopbanks and floodwalls
Raised barriers help keep a river within a planned corridor up to a particular design event. Overtopping, erosion or damage can still occur.
Floodgates and flap gates
Gates control where water can move or prevent river water flowing backwards into drains. Some are operated during events; others work automatically with water pressure.
Spillways and floodways
These provide a planned route for excess water. The Moutoa floodgates, for example, can divert Manawatū River water through the Moutoa floodway toward the sea.
Pump stations
Pumps move water out of low-lying areas when it cannot drain by gravity, particularly when river or tide levels are high.
Detention basins and wetlands
These temporarily store runoff and release it more slowly, reducing the peak flow reaching downstream pipes, streams and properties.
Pipes, catchpits and culverts
These collect and convey stormwater. They can be overwhelmed in events larger than their design capacity, or lose capacity when debris, silt or damage restricts flow.
The reality of floodwater
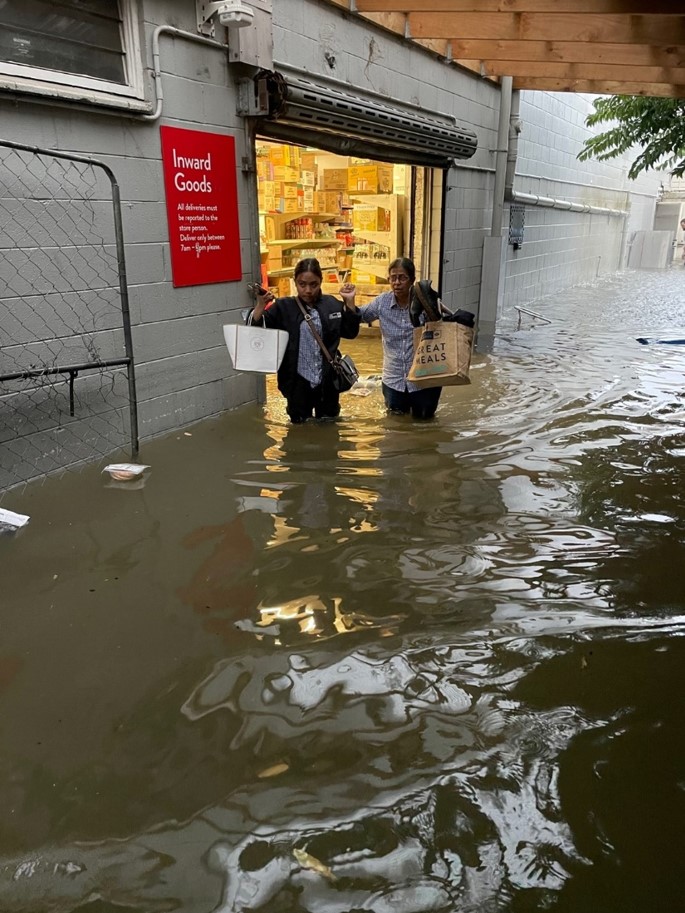
Even shallow-looking water can enter buildings quickly, damage stock and equipment, and make access unsafe.
Flood information by region
Choose your region for a plain-language overview and direct links to official information. Property-level decisions should also use your district or city council’s maps, LIM information and qualified site advice.
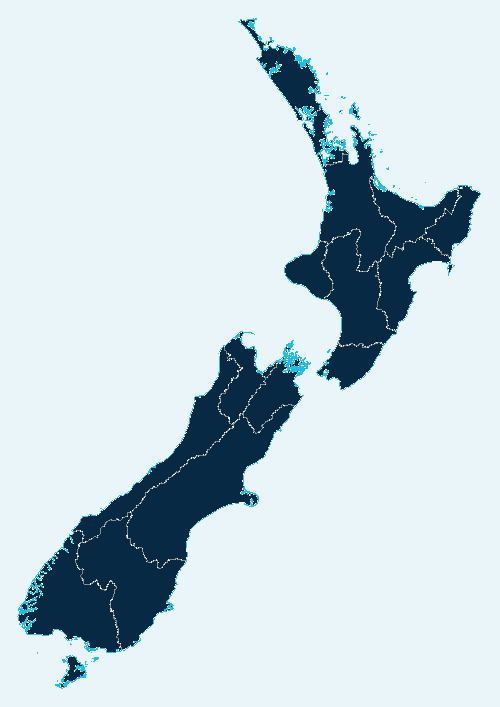
Map: Stats NZ, 2024, via Wikimedia Commons (CC BY 4.0); colour treatment and interactive markers added.
Tap your region
Each selection opens the matching regional overview and its official monitoring links.
Northland / Te Tai Tokerau
Northland can experience intense subtropical rain, short-notice river rises, surface flooding and coastal effects. Short, steep catchments can respond quickly, while low-lying floodplains and estuaries may hold water longer.
Auckland / Tāmaki Makaurau
Auckland’s dense urban catchments can produce rapid surface flooding when intense rain exceeds pipe or inlet capacity. Overland flow paths, flood-prone depressions, streams and coastal inundation can all matter at property level. Major earthworks and development can change local topography, so use the latest available mapping and site observations together.
Waikato
The region includes large river systems, the low-lying Hauraki Plains, steep Coromandel catchments and exposed coastlines. Flooding can involve rivers, local drainage, coastal water levels and long-duration catchment runoff. Waikato Regional Council’s Flood Room uses real-time rainfall, river levels, soil saturation and models, and manages assets including floodgates and pumps.
Bay of Plenty / Te Moana-a-Toi
Major rivers and coastal lowlands mean river, drainage and coastal flooding can interact. The region’s river schemes include stopbanks, floodwalls, floodgates, pumps and drains. Heavy rain in steep upper catchments may take time to move downstream, so local weather alone does not tell the whole story.
Gisborne / Tairāwhiti
Steep terrain, intense rainfall and fast-rising rivers can create short warning times. Flooding may be accompanied by slips, debris and road access problems. Gisborne District Council provides rainfall and river observations, river forecasts and camera feeds, but communications and cameras can be disrupted during severe weather.
Hawke’s Bay / Te Matau-a-Māui
Large rivers, alluvial plains, steep headwaters and smaller fast-response catchments create several kinds of flood risk. Stopbanks and drainage schemes provide important protection, while extreme events can still involve deep or fast water, erosion, debris and changing river channels.
Taranaki
Many Taranaki rivers are short and steep, draining from higher ground toward the coast. Orographic rain can produce rapid rises, and urban surface flooding can occur where local drainage is exceeded. Regional monitoring includes rainfall and river levels, with stations able to transmit more frequently during events.
Manawatū–Whanganui
The region contains large river systems, hill-country catchments and low-lying plains. Manawatū and Oroua river levels, smaller streams, urban drainage and coastal conditions can all affect local risk. Horizons manages numerous river and drainage schemes. The Moutoa floodgates can divert Manawatū River water through the floodway toward the sea, relieving pressure on the lower river. Near Feilding, the Makino floodgates are another visible part of the local flood-management system.
Wellington and Wairarapa
Flood risk varies from fast urban runoff and short coastal streams to major rivers such as Te Awa Kairangi/Hutt, Ōtaki, Waikanae and Ruamāhanga. Steep terrain, constrained valleys, high tides and stormwater capacity can combine. Some urban flood information is held by city or district councils rather than Greater Wellington.
Tasman / Te Tai-o-Aorere
Tasman includes wet western catchments, major rivers, low-lying floodplains and coastal areas. Heavy rain can affect the Aorere, Tākaka, Motueka, Waimea and other catchments, while slips and road isolation may accompany flooding. Council monitoring covers rainfall, river flow, groundwater and tides.
Nelson / Whakatū
Nelson’s steep urban catchments can concentrate runoff quickly into streams and the Maitai/Mahitahi River, while low-lying areas can also be influenced by tide and stormwater capacity. Council operates near-real-time rainfall and flow monitoring across local freshwater management units.
Marlborough
The Wairau system, Ōpaoa and other rivers can respond to rainfall across large upstream catchments. Floodwater may affect floodways, fords, roads and low-lying land before urban areas. Marlborough’s Floodwatch combines rainfall, river flow, level data and local thresholds, with data refreshing automatically.
West Coast / Te Tai Poutini
The West Coast is exposed to very high orographic rainfall. Short, steep rivers can rise rapidly, while the Buller/Kawatiri, Grey/Māwhera and other larger systems can produce widespread flooding. Coastal conditions, slips, debris and transport disruption may occur at the same time.
Canterbury / Waitaha
Canterbury’s flood risk includes large alpine-fed braided rivers, foothill catchments, low-lying plains, urban surface water and coastal drainage. Rain in alpine headwaters may be far from the property it later affects. Snowmelt contributes to seasonal flows, and warm rain on existing snow can add runoff in some catchments.
Otago / Ōtākou
Otago combines alpine lakes and rivers, the Clutha/Mata-Au and Taieri systems, smaller steep catchments, and low-lying urban areas including South Dunedin. Flood drivers range from prolonged catchment rain to intense urban rain, high groundwater, tide and snowmelt contributions.
Southland / Murihiku
The Mataura, Ōreti, Aparima and Waiau systems drain large catchments into low-lying plains and estuaries. Heavy rain, saturated ground, local drainage constraints and, at times, snowmelt can combine. River levels may continue to rise after rain eases in the immediate area.
When to pay closer attention
- Before forecast heavy rain: check MetService warnings and the upstream gauges for your catchment—not only the weather at your property.
- After several wet days: saturated soil and already-high waterways can make another rainfall event more significant.
- During ex-tropical cyclones and subtropical lows: northern and eastern regions can receive prolonged or intense rain, but tracks and impacts vary.
- During winter and spring in alpine catchments: watch for combinations of snow, thaw and rain rather than assuming snow itself always means immediate flooding.
- When high tide and storm surge coincide: coastal water levels can restrict river and stormwater discharge.
Prepare your property or site
1. Learn how water arrives
Check official flood maps, your LIM, historic events, upstream catchments, overland flow paths and nearby drains. Ask neighbours what they have observed, but verify against authoritative information.
2. Identify what must be protected
Prioritise people first, then critical doorways, garages, equipment, stock, electrical assets, plant rooms and business-continuity functions.
3. Set a deployment trigger
Decide in advance which warning, river level, forecast or on-site observation starts action. Allow time for staff travel, installation and changing conditions.
4. Match the barrier to the site
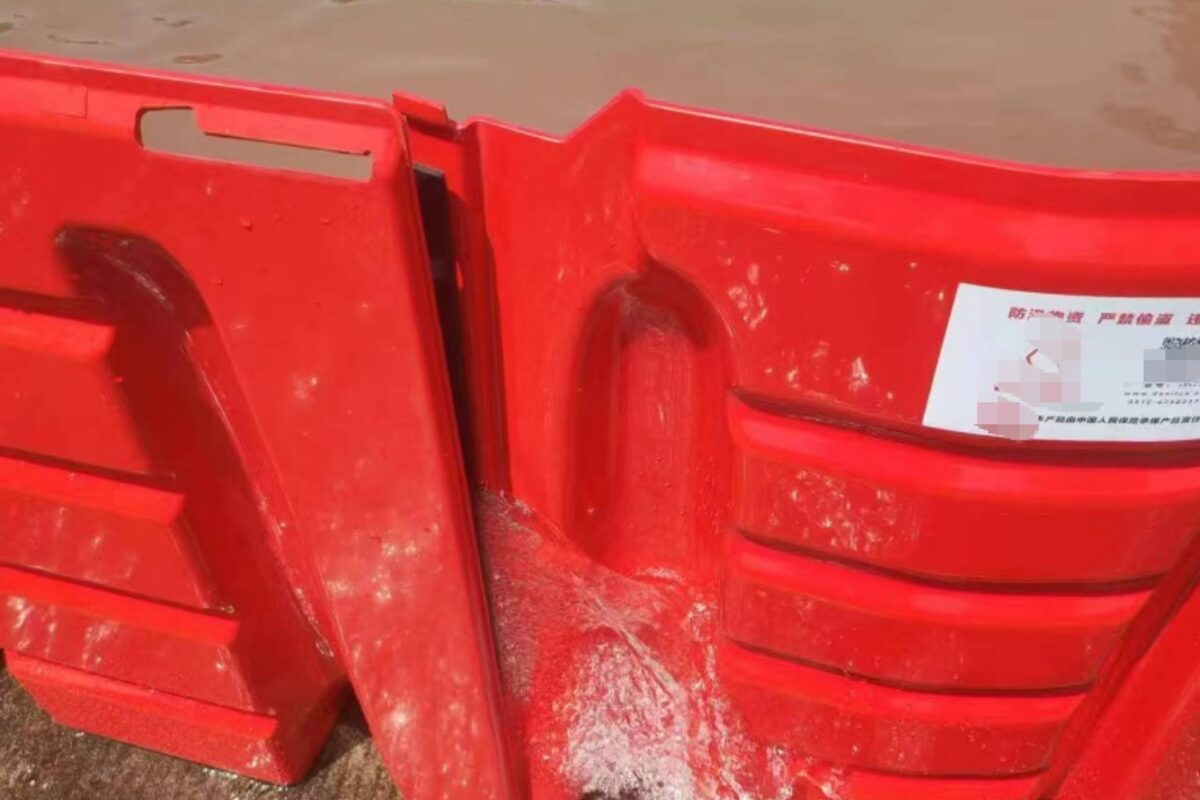
Consider expected depth, current, ground surface, width, corners, anchoring, drainage behind the barrier, access and safe removal. A doorway solution and a perimeter solution solve different problems.
5. Practise in dry weather
Label parts, photograph the setup, assign roles and record realistic deployment time. Keep tools, pumps and protective equipment with the system.
6. Keep an evacuation plan
Portable barriers support preparation; they never replace Civil Defence instructions or safe evacuation. Do not deploy a system once conditions make the work unsafe.
Compare flood protection systems
Once you understand how water may reach the site, compare reusable barriers by opening width, expected conditions, ground surface, storage and deployment time.
Turn regional information into a site plan
Special Solutions Flood Protection supplies flood-barrier systems throughout New Zealand and provides practical, site-specific guidance. Installation is available across the wider Manawatū–Whanganui region. Send us photos, measurements and what you know about the way water reaches your property, and we can help identify a suitable starting point.
Important: This page is general educational information, not real-time emergency advice, engineering certification or a guarantee that a property will not flood. River and rainfall feeds may be delayed, unavailable or provisional. Follow official warnings and obtain property-specific advice where decisions affect life safety, building work or critical infrastructure. Information and links last reviewed 8 September 2026.